0 Down time
GraphQL
NextJS
Mongo
VITE
MEAN
MERN
Rust
Spring
Hibernate
Liquid
SASS
REST
Spring
React
Angular

Fun With Numbers

See the Pen Fun With Numbers by jonclawson (@jonclawson) on CodePen.

React Version

See the Pen React with Numbers by jonclawson (@jonclawson) on CodePen.

Angular VX

See the Pen Angular 6 starter by jonclawson (@jonclawson) on CodePen.

I had some free time last Saturday, so I decided to play with d3.format() and created an AngularJS number filter for formatting numbers in common formats you might see on a website or application. This is what I came up with.

Just to be fair, I decided to make a React as well as an Angular 6 version too.

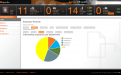
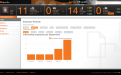
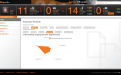
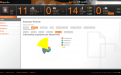
D3.js (Data-Driven Documents) is an open-source JavaScript library for creating dynamic and interactive data visualizations in web browsers. It allows developers to bind data to Document Object Model (DOM) elements and then apply data-driven transformations to create complex and customized visual representations of data.

Key features and concepts of D3.js include:

Data Binding: D3.js enables you to bind data to DOM elements, associating data values with visual elements like SVG shapes, HTML elements, or Canvas graphics.

Data-Driven Transformations: D3.js allows you to apply data-driven transformations to manipulate the visual properties of elements, such as position, size, color, and shape.

SVG and Canvas Support: D3.js works with Scalable Vector Graphics (SVG) and HTML Canvas, giving you flexibility in choosing the appropriate rendering technology for your visualizations.

Selections: D3.js provides a powerful selection mechanism that allows you to select, filter, and manipulate DOM elements based on data conditions.

Data Joins: D3.js supports data joins, where you can efficiently join data with existing DOM elements or create new elements based on data.

Transitions and Animations: D3.js allows you to create smooth transitions and animations to enhance the visual experience of your data visualizations.

Scales and Axes: D3.js provides scale functions to map data values to visual attributes, such as positioning data on axes or determining the size of elements.

more...

Measuring Up

Measuring Up

Measurabl is a software platform designed to help organizations manage and report on their sustainability and environmental, social, and governance (ESG) performance. It provides tools for collecting, analyzing, and reporting data related to sustainability initiatives, energy usage, water consumption, greenhouse gas emissions, and other key metrics.

For the past 6 years I spent with Measurabl, I led the upgrade of a web application to a modern framework with a custom build with new dependencies for theming, internationalization and deployment chosen and implemented by me. Over the years, I directly engineered a library of reusable presentational components such as tables, forms, maps and charts which I used in multiple premium subscription features of the application. Additionally, I integrated many 3rd party services into the app with internationalization, reporting and deployment/debugging technologies. 

In collaboration with the development team, we developed a web application and optimized the quality and efficiency of the CI/CD process. With a passion for building rich UI frontend applications and efficient APIs and proficiency in software technologies has allowed me to bridge the gap between technical and non-technical audiences. Resolving client demands and simplifying technical issues.

One of the premium subscription features I engineered was the Physical Climate Risk Report. This report required a client side component base UI to communicate with a REST API to render climate risk data as a report for the customer's portfolio. The UI report consists of filters to refine the results to specific climate risks and locations with the results produced on a page with charts, tables and a maps. There is also a PDF export rendered on the backend server with additional charting libraries.

more...

Company Reporting

In the StaffingNation.com online application for employee on-boarding and management, administrators can view and charts and tables of details powerd with D3 and jqgrid. 

more...

script